



Issue No. 001
Q1 2026
NorthStar Index — Q1 2026 (Issue 001)
Quarterly Insights on Construction Cost & Project Risk.
The ratchet continues
Construction costs continued to rise in Q1, led by electrical and metal-intensive systems.
The leading category ran well ahead of the basket
Q1 AVERAGE
8.2%
Average YoY movement across the six tracked materials.
ABOVE 10%
3 of 6
Feeder / copper, aluminum and rebar exceeded 10% YoY.
HIGHEST MOVEMENT
14.9%
400A feeder / copper led the tracked material basket.
The upward pressure was broad, but it was not evenly distributed. Electrical feeders, aluminum and reinforcing steel were already moving faster than the broader material basket.
The question is not simply “How much are costs rising?” It is “Which packages are moving faster than the project average?”
About the NorthStar Index: The NorthStar Index is NorthStar Estimating's quarterly publication on construction cost trends, project risk, and market conditions affecting the built environment. Rather than simply reporting price movements, the Index interprets what those movements mean for owners, architects, engineers, construction managers, and contractors making decisions today.
This is how we think at NorthStar.
Q1 AT A GLANCE
A broad increase with a clear leading edge
Most tracked materials moved higher, but electrical and metal-intensive systems were beginning to separate from the rest of the market.
The steady ratchet
Across the six benchmark materials tracked by the NorthStar Index, average year-over-year movement was 8.2% in Q1.
Five of the six materials increased from a year earlier, and three exceeded 10%. PVC pipe was the only category that remained flat.
The quarter extended the steady upward ratchet that followed the 2023 plateau. Copper-related feeder costs led the underlying movement, while aluminum and reinforcing steel also remained firm.
The better question
Which packages are moving faster than the project average?
The average can hide materially different exposure from one trade package to another.
What it means
Q1 calls for a trade-specific approach to escalation.
Projects with limited electrical distribution or metal-intensive work may track closer to the mid-single-digit movement seen in ready-mix and lumber.
Projects with major feeders, aluminum systems or reinforcement-heavy structures may face double-digit exposure in the packages that matter most to the budget.
A single escalation assumption can therefore understate risk in critical trades while overstating it elsewhere.
NORTHSTAR VIEW
Apply escalation where the scope creates exposure, not simply as one percentage across the entire estimate.
CONVENTIONAL INPUTS
Still rising
Lumber and ready-mix moved 5.6% to 7.5% year over year.
METAL-INTENSIVE SCOPES
Elevated pressure
Aluminum and rebar both exceeded 10% year over year.
ELECTRICAL SYSTEMS
Leading the market
400A feeder / copper increased 14.9% year over year.
WHAT WE'RE WATCHING
Copper and metal inputs are pulling away
Electrical feeders, aluminum systems and reinforcing steel are moving faster than the broader basket, increasing the value of early quantity definition.
Electrical distribution
The 400A feeder / copper benchmark increased 14.9% year over year, the strongest movement among the six materials tracked in Q1.
The exposure is not limited to copper as a commodity. Service size, feeder length, conductor material, pathway requirements and equipment coordination can multiply the effect across an electrical package.
The message for early design: define electrical distribution far enough to test the assumptions before a placeholder allowance becomes embedded in the budget.
14.9%
HIGHEST YOY MOVEMENT
400A feeder / copper led the Q1 benchmark basket.
01
Define distribution
Confirm loads, service size, feeder lengths, conductor material and pathway requirements early.
02
Validate metal quantities
Quantify rebar, aluminum framing, panels and other metal-intensive scopes before allowances harden.
03
Test alternatives
Evaluate routing, conductor options, finish systems and approved substitutions while choices remain open.
Structure & reinforcement
Ready-mix increased 5.6%, while rebar increased 10.4%. One blended structural escalation assumption can mask materially different pressure within the same building system.
Specifications & substitutions
PVC pipe was flat while metal inputs moved higher. Material selection, approved alternatives and specification timing can meaningfully change a project's exposure.
BY THE NUMBERS
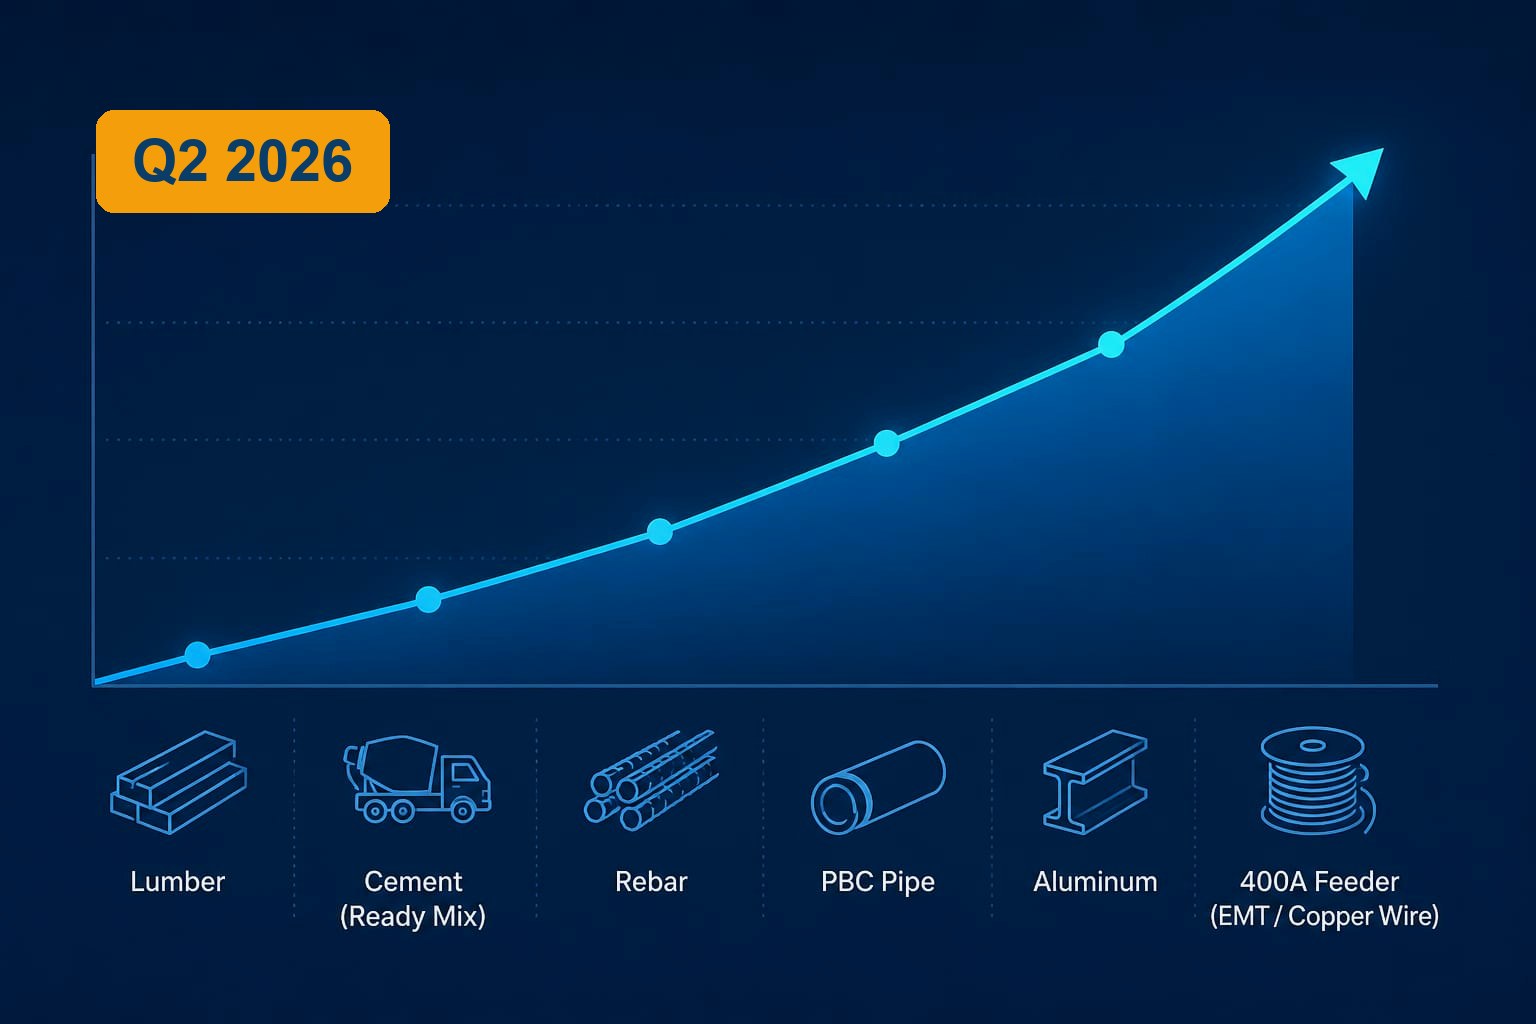
Three materials exceeded 10% year over year
Copper-related feeders, aluminum and rebar led the quarter. Lumber and cement remained firm, while PVC pipe was flat.
Sources: publicly available producer-price data; construction market reporting; supplier intelligence; contractor feedback; NorthStar Estimating review of bid activity. Values are planning indicators, not project-specific pricing.
Lumber
+7.5% YoY
Lumber remained above normal escalation despite a less volatile pattern than prior market peaks.
NorthStar Perspective: Validate framing-heavy scopes and procurement timing.
Cement / ready-mix
+5.6% YoY
Ready-mix continued to increase, with local supply, haul distance and market capacity remaining important.
NorthStar Perspective: Validate pricing regionally rather than relying on a national average.
Rebar
+10.4% YoY
Reinforcing steel moved well above the composite average and remained a key exposure for structural work.
NorthStar Perspective: Monitor concrete-intensive and infrastructure projects.
PVC pipe
+0.0% YoY
The benchmark was flat year over year, providing a relative point of stability within the material basket.
NorthStar Perspective: Standard contingency remains appropriate for most projects.
Aluminum
+10.8% YoY
Aluminum remained elevated across metal-intensive architectural and building-system applications.
NorthStar Perspective: Define quantities early and avoid broad placeholder allowances.
400A feeder / copper
+14.9% YoY
Copper-related electrical components were the strongest cost mover among the tracked materials.
NorthStar Perspective: Prioritize feeder scope, conductor assumptions and electrical coordination.
NORTHSTAR INSIGHT
Escalation should follow the scope
Q1 shows why one project-wide percentage can miss the packages creating the greatest budget pressure.
ONE QUESTION WORTH ASKING
If three tracked materials are moving above 10%, does one escalation percentage still describe your project?
For many projects in Q1, the answer is no.
FOR OWNERS
Review contingency and escalation by trade package, not only at the project level.
FOR ARCHITECTS
Identify electrical, aluminum and reinforcement-heavy scopes before the design becomes fixed.
FOR CONSTRUCTION MANAGERS
Validate key electrical and metal-intensive packages with trades and suppliers as early as practical.
Methodology
The NorthStar Index tracks six benchmark construction materials that consistently influence institutional and public-sector project budgets. Each material is indexed to 100 at Q1 2021 and equally weighted within the composite index.
Material movements are informed by publicly available producer-price data, construction market reporting, supplier intelligence, contractor feedback and NorthStar Estimating's ongoing review of bid activity across the markets we serve.
How to use the index
The NorthStar Index is a planning and budgeting tool. Project-specific estimates should reflect scope, procurement strategy, schedule, location and prevailing market conditions.
No general index replaces trade-level quantity validation, local market testing or a project-specific estimate.
Good estimating is not about reacting to the market. It is about understanding which parts of the market matter to your project.
This is how we think at NorthStar.
NorthStar
Estimating, Inc.
northstarestimating.com