



Issue No. 003
Q3 2026
NorthStar Index — Q3 2026 (Issue 003)
Quarterly Insights on Construction Cost & Project Risk.
Pressure broadens
Q3 reversed the moderation seen in Q2 as metals and lumber reaccelerated.
The pause was brief
Q3 AVERAGE
18.0%
Average YoY movement across the six tracked materials.
CHANGE FROM Q2
+12.8 pts
Benchmark pressure accelerated sharply quarter over quarter.
DOUBLE-DIGIT BENCHMARKS
4 of 6
Lumber, rebar, aluminum and copper exceeded 10% YoY.
The Q3 story is not that every project suddenly needs 18% escalation. It is that the materials carrying the most risk changed quickly.
Metals now dominate the index. The better question is “Which trade packages are carrying the return of pressure?”
About the NorthStar Index: The NorthStar Index is NorthStar Estimating's quarterly publication on construction cost trends, project risk, and market conditions affecting the built environment. Rather than simply reporting price movements, the Index interprets what those movements mean for owners, architects, engineers, construction managers, and contractors making decisions today.
This is how we think at NorthStar.
Q3 AT A GLANCE
The market widened again
Q2's moderation proved temporary. The Q3 move is concentrated, but it now reaches more of the project than electrical infrastructure alone.
A broader pressure set
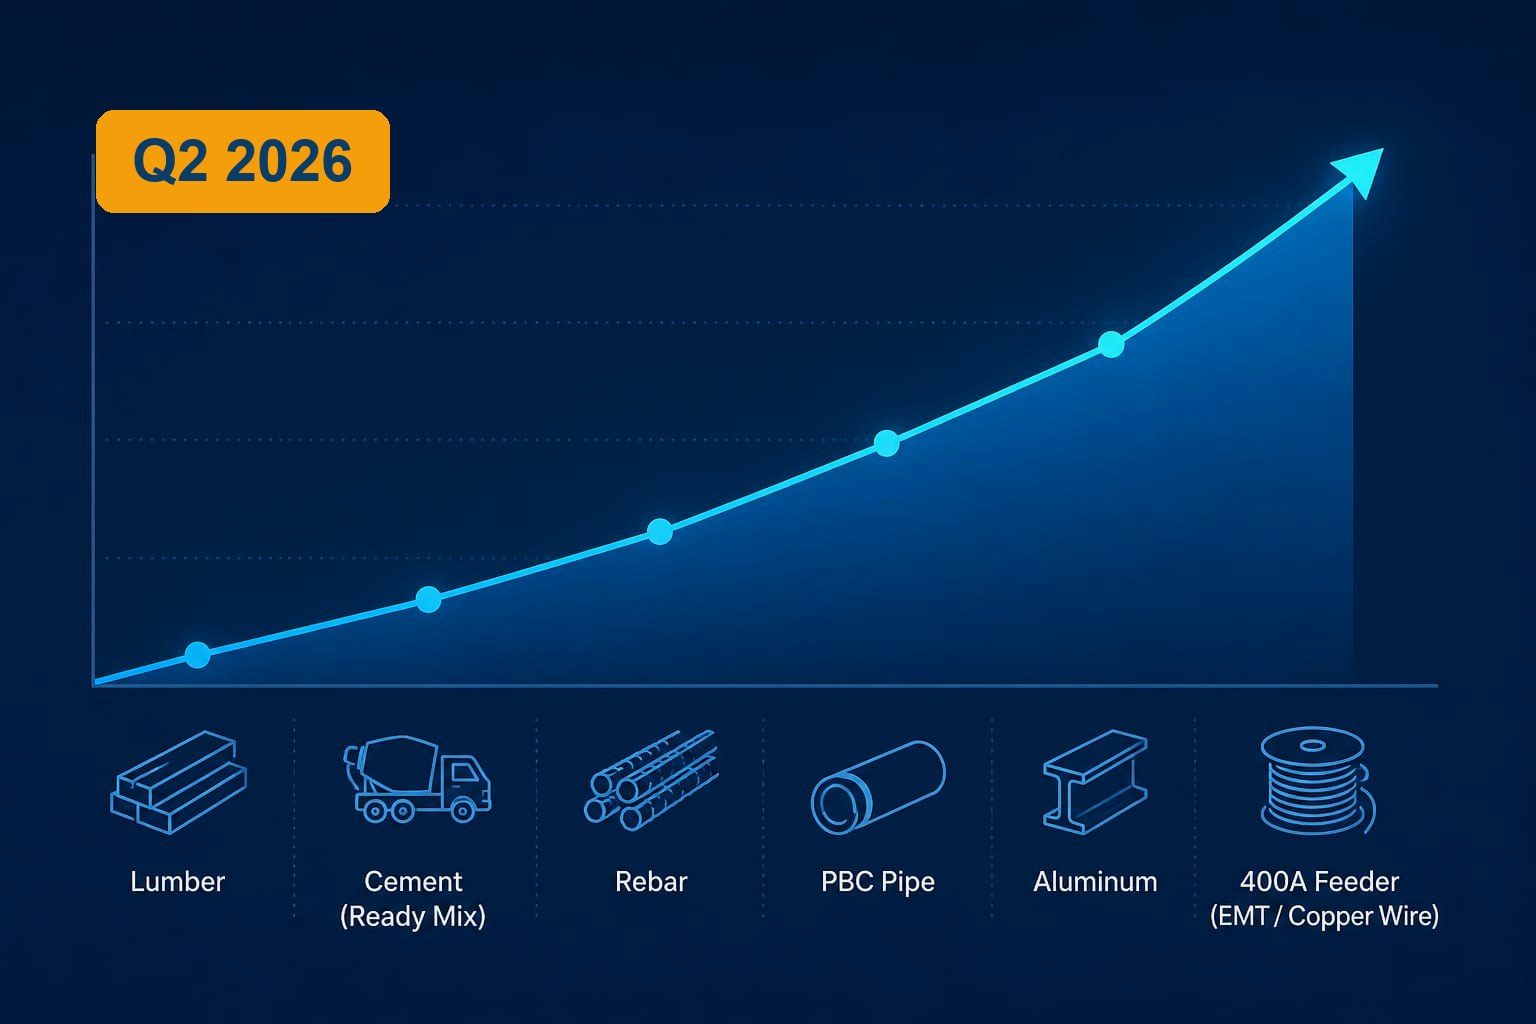
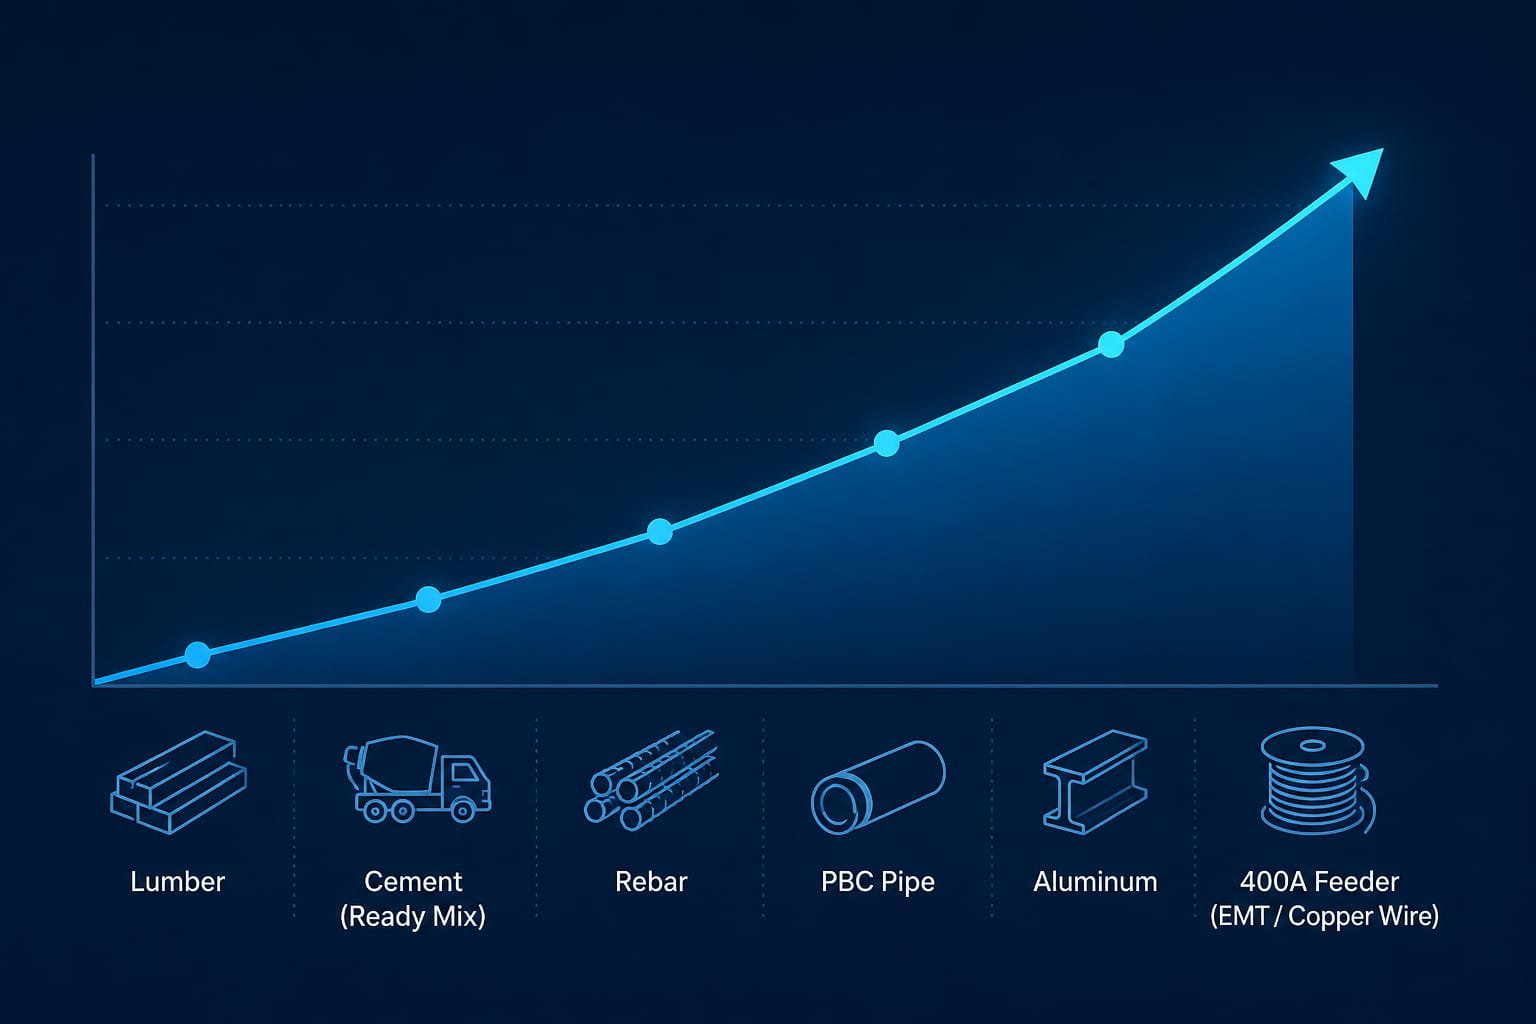
Across the six benchmark materials tracked by the NorthStar Index, average year-over-year movement rose from 5.2% in Q2 to 18.0% in Q3.
Four of the six benchmarks are now above 10% year over year. Rebar and copper are near 30%, aluminum is above 25%, and lumber has moved back into double digits.
Ready-mix and PVC remain comparatively measured. The result is a market where the average has moved sharply, but project impact still depends on what the project is actually buying.
The better question
Which trade packages actually carry the exposure?
The benchmark average is a signal, not a project escalation rate.
What it means
Q3 requires more deliberate escalation by package.
An 18.0% benchmark average is not an 18.0% project escalation rate. Conventional finishes and concrete-heavy scopes may still see more moderate movement.
Structural steel, reinforcing, aluminum and copper-rich electrical packages should be repriced against current market conditions rather than carried forward from earlier estimates.
For projects with extended design or procurement schedules, timing now matters as much as the escalation factor. Early package definition can reduce exposure before the market moves again.
NORTHSTAR PERSPECTIVE
The more volatile the market becomes, the less useful a single project-wide percentage becomes.
LOWER-EXPOSURE SCOPES
Monitor normally
Ready-mix, conventional finishes and select plastics where current pricing remains stable.
METAL-INTENSIVE SCOPES
Reprice now
Rebar, structural steel, aluminum and copper-rich assemblies.
PROCUREMENT-SENSITIVE SCOPES
Lock strategy early
Steel packages, electrical distribution and long-lead equipment.
WHAT WE'RE WATCHING
Steel is becoming an availability issue, not just a price issue
Rebar accelerated sharply in Q3 while reports of allocations and extended lead times began affecting structural packages.
Steel availability
Rebar and bar joists were approximately 30% higher year over year in September, while steel mill products were up about 28%.
Pricing is only one part of the problem. Contractors are reporting reduced allocations, full mill order books and longer lead times for beams, joists and other structural products.
Availability now belongs in the estimate. A structural package that is priced correctly but assumed to arrive on a normal schedule can still move the project budget through acceleration, resequencing or extended general conditions.
30.0%
YOY
September 2026 movement in fabricated bar joists and concrete reinforcing bars.
01
Validate tonnage
Confirm reinforcing, joist and structural steel quantities before design assumptions become procurement assumptions.
02
Engage fabricators
Test mill availability, fabrication capacity and acceptable alternates while the design is still flexible.
03
Protect the schedule
Evaluate early release, sequencing, substitutions and procurement allowances before the bid set.
Electrical remains exposed
Copper wire and cable remained above 30% year over year, and switchgear pricing also stayed elevated. Electrical infrastructure continues to require early scope definition and procurement planning.
Fuel & freight
Higher energy and transportation costs broadened the pressure beyond materials alone. Freight remains a secondary driver, but it can amplify already-elevated metal and equipment pricing.
BY THE NUMBERS
Metals now define the quarter
Four of six benchmark materials are in double digits. Copper and rebar are near 30%, with aluminum above 25%.
Sources: U.S. Bureau of Labor Statistics Producer Price Index, September 2026 (preliminary); AGC and ABC market reporting; supplier intelligence; contractor feedback; NorthStar Estimating review of bid activity. Values are planning indicators, not project-specific pricing.
Lumber
+14.2% YoY
Softwood lumber moved back into double digits year over year, despite easing during September.
NorthStar Perspective: Revalidate lumber-intensive packages; do not assume the late-quarter dip represents a reset.
Cement / ready-mix
+2.3% YoY
Ready-mix remained comparatively stable and was essentially flat during September.
NorthStar Perspective: Validate regionally and continue standard escalation for most conventional concrete scopes.
Rebar
+30.0% YoY
Reinforcing bars and bar joists accelerated sharply, with both price and availability now affecting structural packages.
NorthStar Perspective: Obtain current supplier or fabricator input on concrete-intensive and infrastructure projects.
PVC pipe
+5.5% YoY
Plastics pipe increased year over year but remained relatively stable through the quarter.
NorthStar Perspective: Standard contingency remains appropriate, with continued monitoring of resin, energy and freight.
Aluminum
+25.2% YoY
Aluminum mill shapes remain elevated amid tariff exposure, supply constraints and sustained demand.
NorthStar Perspective: Quantify storefront, curtain wall, louvers and specialty metals early rather than relying on generic allowances.
400A feeder / copper
+30.8% YoY
Copper wire and cable remains one of the strongest areas of price pressure across institutional projects.
NorthStar Perspective: Reprice major feeders, verify conductor lengths and coordinate procurement before the design is fixed.
NORTHSTAR INSIGHT
Volatility makes timing part of the estimate
Where a package is exposed, the date you validate, bid or buy it can matter as much as the escalation percentage.
ONE QUESTION WORTH ASKING
If a package is up 25%-30% year over year, are you still carrying it on a generic escalation assumption?
For the most exposed scopes this quarter, current market validation matters more than a blanket project factor.
FOR OWNERS
Separate contingency and escalation for structural, electrical and metal-intensive packages, and identify early-release decisions.
FOR ARCHITECTS
Advance package definition and alternates early enough to respond before pricing or availability becomes a design constraint.
FOR CONSTRUCTION MANAGERS
Test steel and electrical capacity with trade partners and suppliers before buyout, not after the schedule is committed.
Methodology
The NorthStar Index tracks six benchmark construction materials that consistently influence institutional and public-sector project budgets. The quarterly year-over-year average shown in this publication equally weights the six benchmarks; it is a market signal, not a project escalation rate.
Q3 benchmark indicators use the closest relevant national producer-price categories for softwood lumber, ready-mix concrete, reinforcing bars and bar joists, plastics pipe, aluminum mill shapes, and copper wire and cable. The longer-term Index remains normalized to Q1 2021. Market interpretation also reflects supplier intelligence, contractor feedback and NorthStar Estimating's review of bid activity.
How to use the index
The NorthStar Index is a planning and budgeting tool. Project-specific estimates should reflect scope, procurement strategy, schedule, location and prevailing market conditions.
No general index replaces trade-level quantity validation, local market testing or a project-specific estimate.
Good estimating is not about reacting to the market. It is about understanding which parts of the market matter to your project.
This is how we think at NorthStar.
NorthStar
Estimating, Inc.
northstarestimating.com